
Örnek Kullanım: Notlandırma Akışı
6. Sonuçları gör
Notlar yayınlandıktan sonra Sonuçları Görüntüle sayfası sınıfın genel performansını özetler. Buradan hem istatistikleri inceleyebilir hem de notları dışa aktarabilirsiniz.
Sonuçlar ekranı
Grafikte soru ortalamaları ve ödev/sınav genel ortalaması birlikte görünür. Özet kutuları en düşük, ortanca, en yüksek, ortalama ve standart sapma değerlerini hızlıca verir.
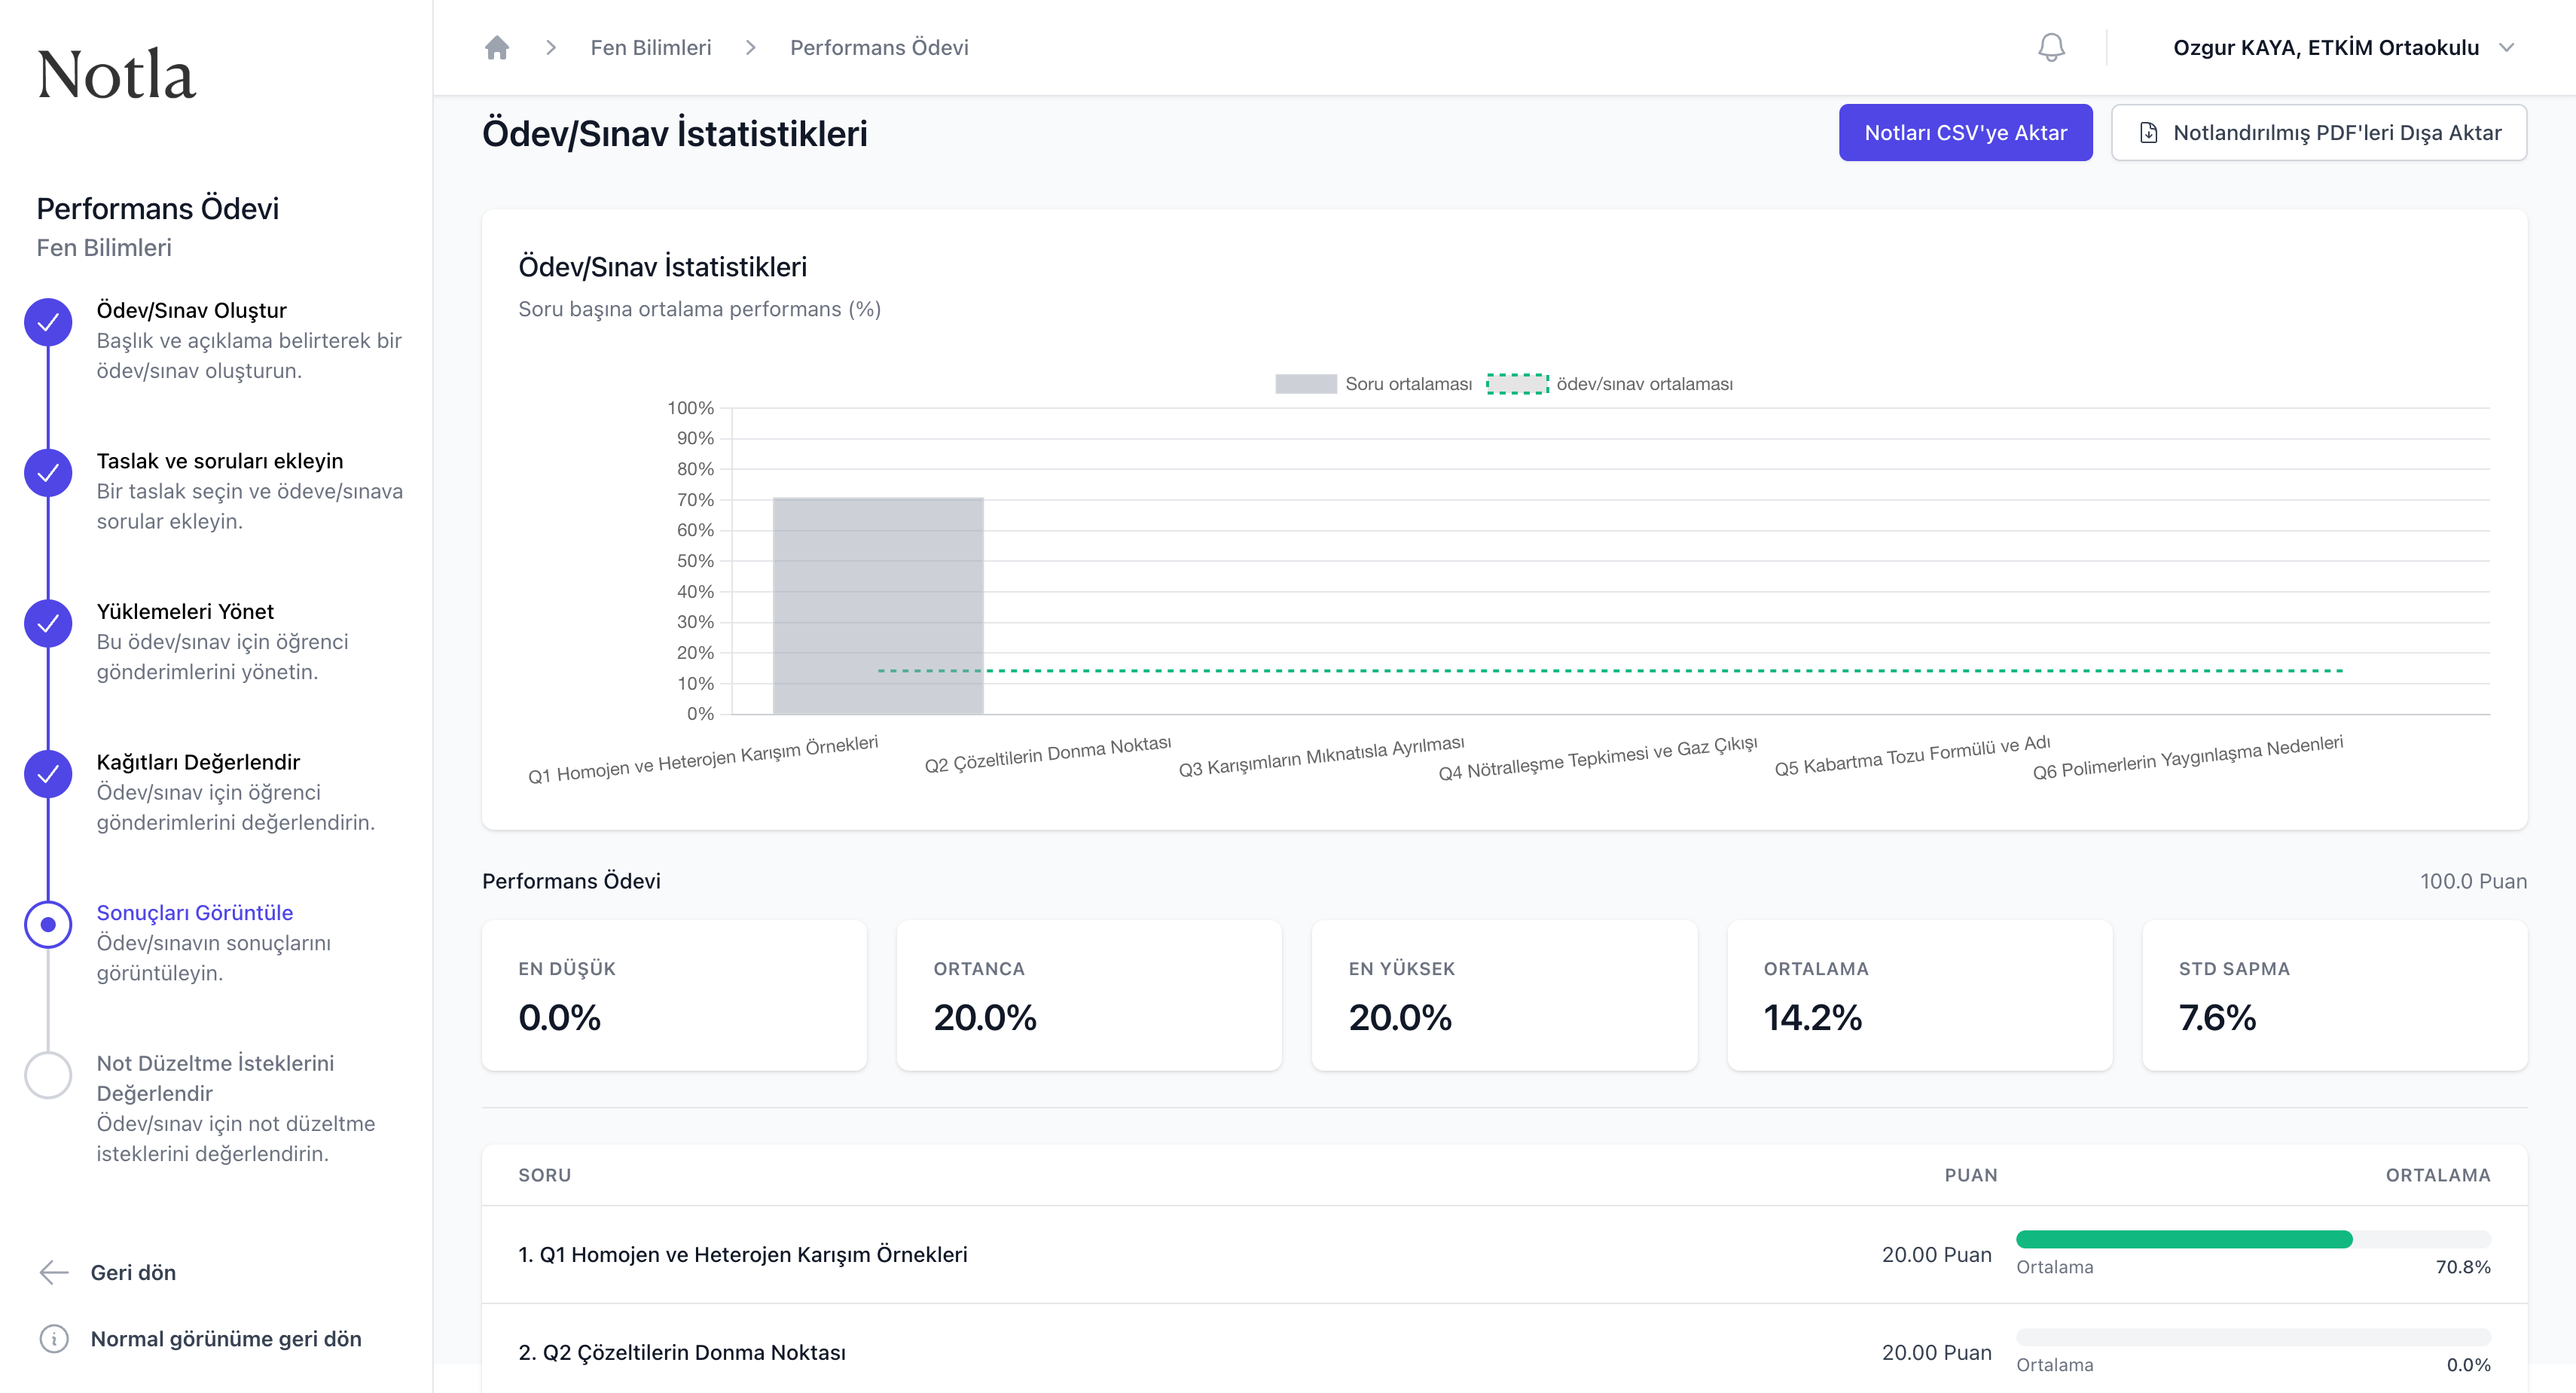
- Soru ortalaması (gri çubuklar) hangi soruda sınıfın ne kadar iyi olduğunu görselleştirir; düşük çubuklar zorlandığı konuları işaret eder.
- Ödev/sınav ortalaması (kesik yeşil çizgi) tüm sorular boyunca sınıf genel ortalamasıdır.
- Beş özet kutu (En Düşük, Ortanca, En Yüksek, Ortalama, Std Sapma) sınıf dağılımını rakamla özetler.
- Sağ üstteki Notları CSV'ye Aktar ve Notlandırılmış PDF'leri Dışa Aktar düğmeleri dışa aktarım için kullanılır.